BunjilView provides intuitive, interactive tools and reports, giving you the insights, measurements, and data you need to make informed decisions for land, infrastructure, and environmental management.
Share maps, dashboards, and datasets instantly with internal teams and external stakeholders. Collaborate in real time on 2D and 3D maps, interactive 4D scenes, and live data visualisations. Keep everyone aligned, enable transparent decision-making, and support collaborative planning across projects and locations with an intuitive, responsive interface.
Generate visual reports, overlay multiple datasets, and track changes over time. Analyse environmental, cultural, and infrastructure data using interactive charts, narrative-driven data stories, and comparison tools to make informed decisions. Time-series support lets you understand trends and changes across locations or periods.
Detect land, vegetation, infrastructure, and species changes. Combine multi-sensor datasets, analyse time-series trends, and identify anomalies or emerging risks for proactive, data-driven management.
Robust access controls and compliance standards safeguard sensitive data, cultural knowledge, and environmental information. Protect communities and organisational assets with secure digital workflows, user permissions, and audit-ready reporting.
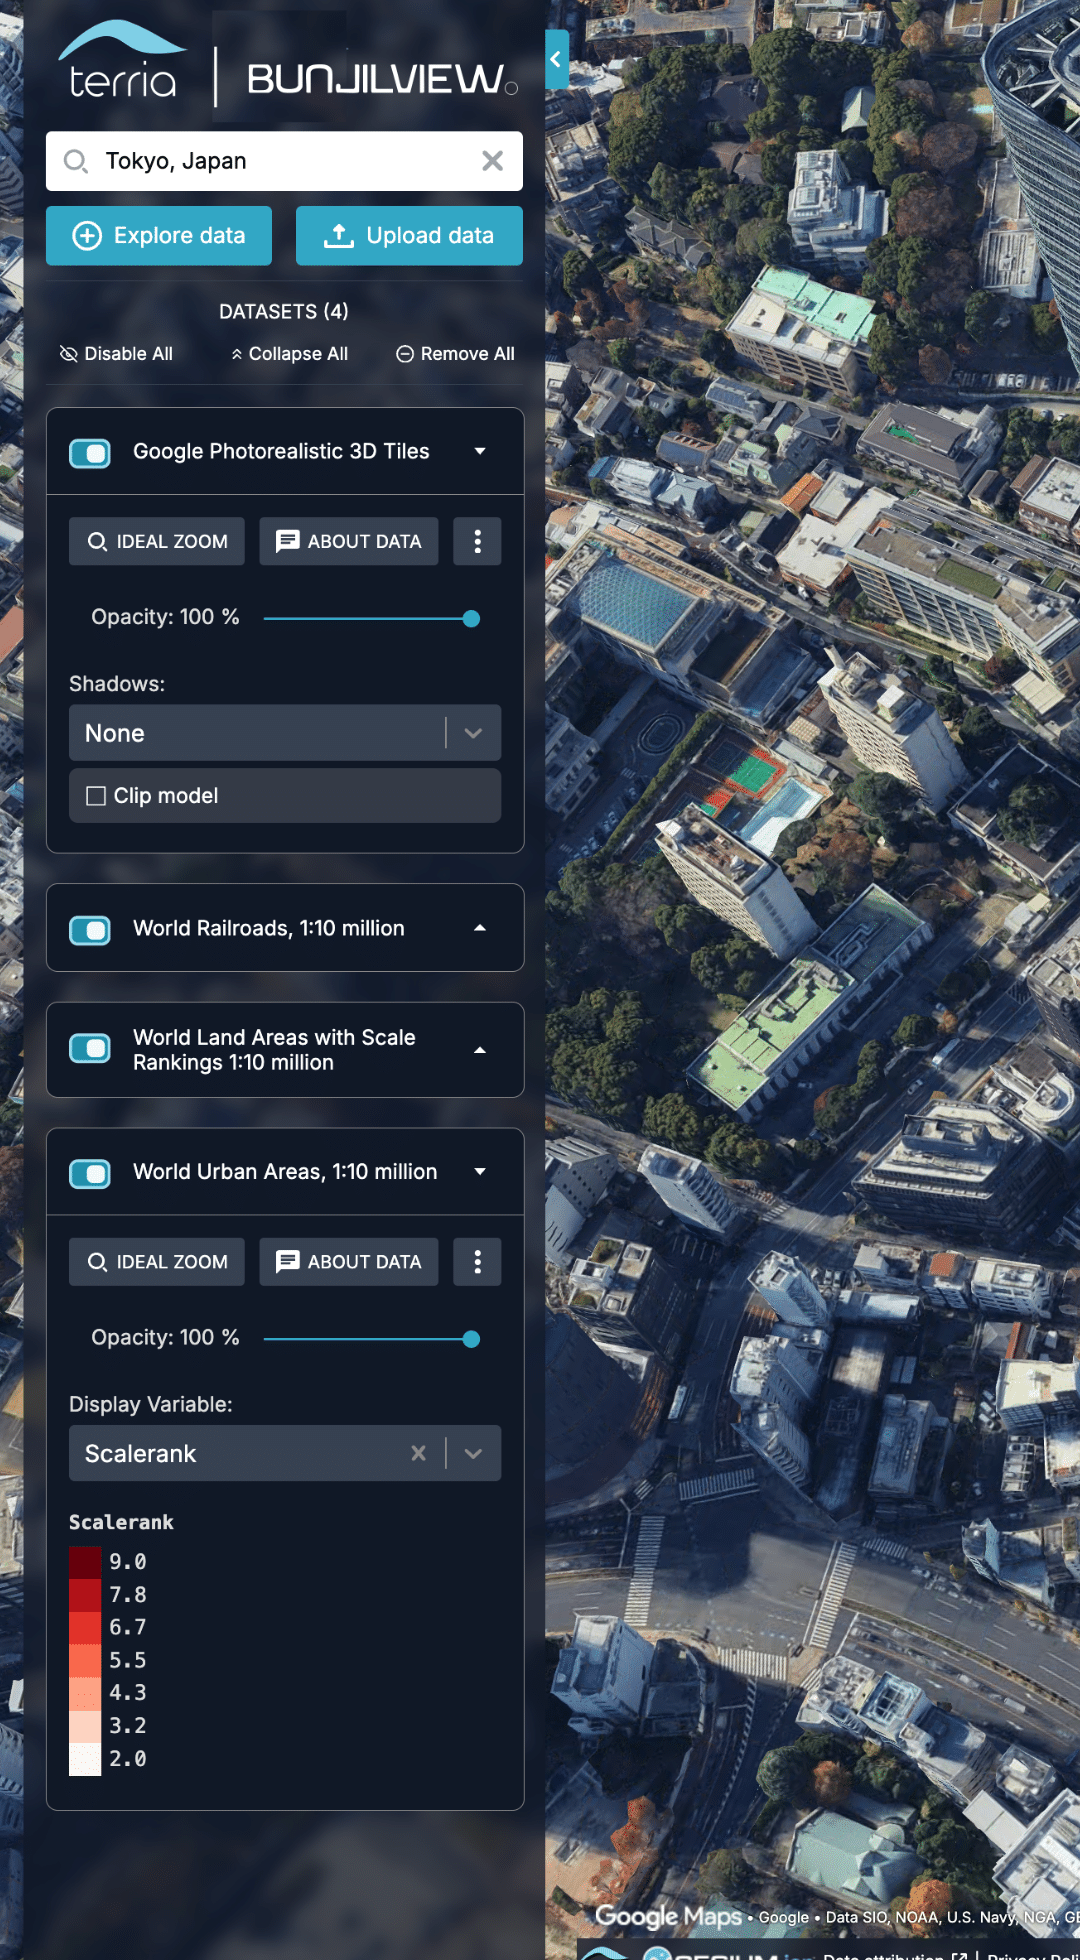
Integrate satellite imagery, drone captures, IoT feeds, and geospatial datasets (WMS, WMTS, GeoJSON, CSV, LiDAR) into a central platform. Annotate, tag, and visualise insights, create interactive 3D/4D scenes, and use scene editing tools for immersive monitoring, asset management, and operational planning.
Rapidly process large datasets and reduce delays in inspections and monitoring. Run geoprocessing tasks, analyse time-series data, and leverage AI-driven predictive models to identify issues and trends faster—helping teams safeguard communities, ecosystems, and Country through timely, proactive interventions.
Export maps, dashboards, and reports in multiple formats. Connect to live data catalogues, automatically map regions from CSVs, and integrate insights into project management platforms or ESG reporting.
Stay updated with automated alerts for changes in land, assets, environmental conditions, or species movements. Create interactive dashboards and actionable insights to respond quickly to emerging issues, ensuring safe, efficient, and sustainable operations.
Visualise multiple data layers simultaneously
Reveal insights hidden in the landscape. Compare changes over time, explore environmental trends, and make informed decisions with clarity and confidence.


By choosing to partner with BunjilView, you are choosing to support a First Nations-led organisation that reinvests 20% of all profits into the Pauline E. McLeod Foundation. Dedicated to creating opportunities for the next generation, the Foundation’s focus areas include First Nations mental health, entrepreneurship, and education, as well as career pathways in the tech and geospatial sectors for young First Nations Australians.